
€169.000
-
Net rental yield Estimated annual rental return, calculated as: (Estimated annual income - operating expenses) / (Purchase price + renovation) 5,6%
-
Annual net income Rental revenue net of all operating expenses (Property management, cleaning, communal fees, utilities,...). It does not include mortgage payments or income taxes. €10.155
-
Price / m2 discount Estimated discount per m2 of this property compared to other similar properties within 300m -42%
-
Transaction costs Transaction costs (Notary, agency fees and registry), taxes (ITP) and property renovation €34.655

Description
- Size: 111
- Rooms: 1
- Bathrooms: 1
- Elevator: Yes
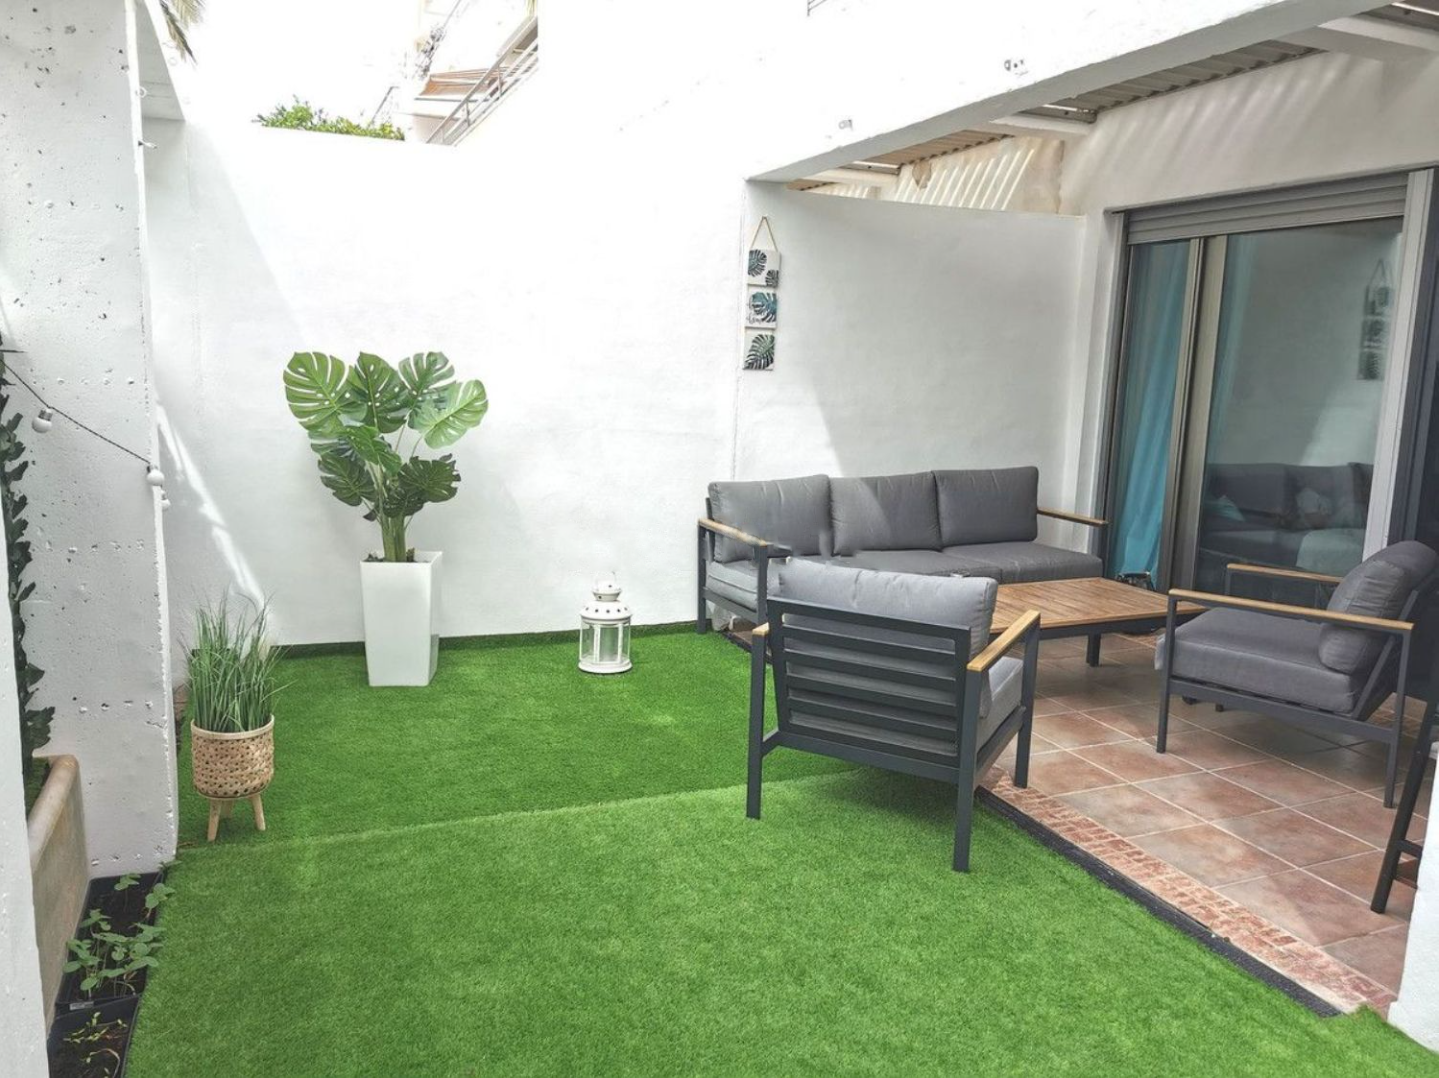
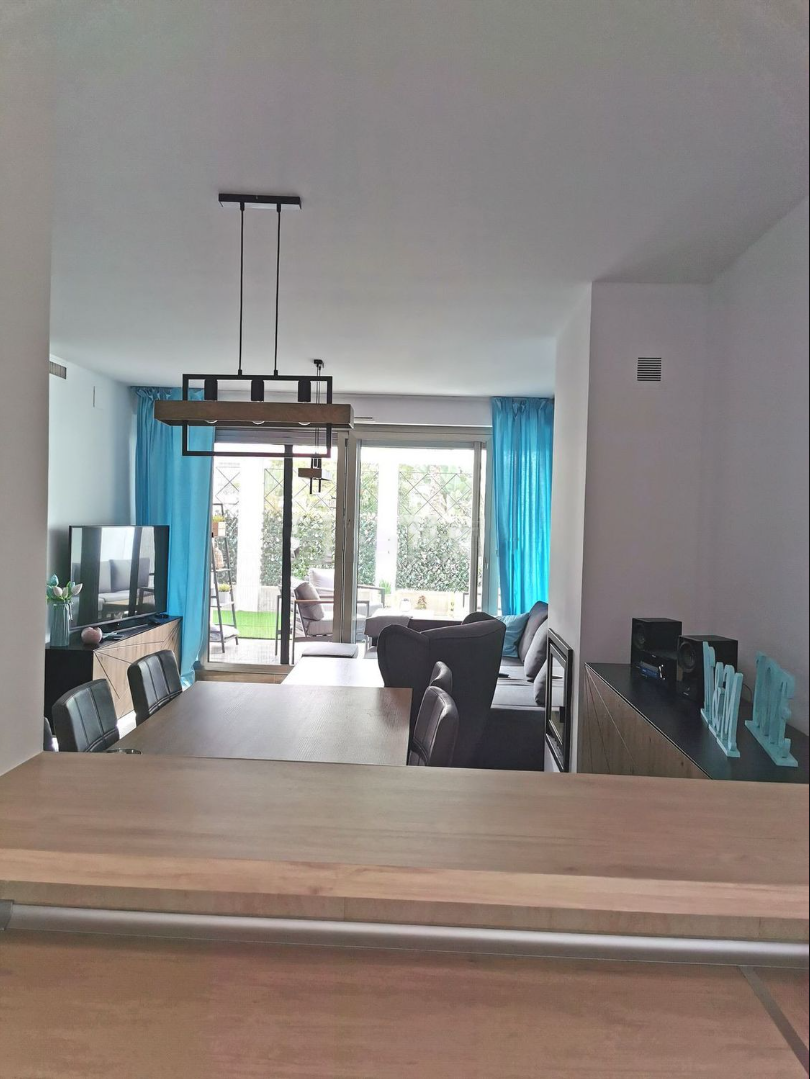
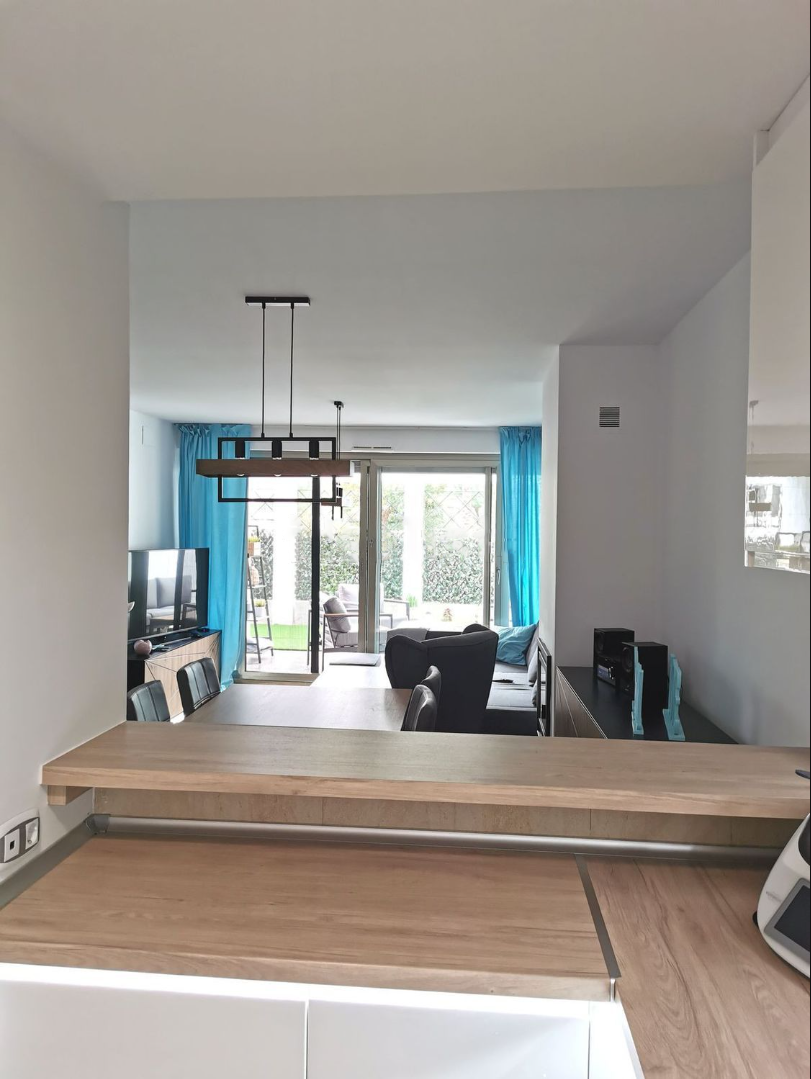
- Condition: Renovated
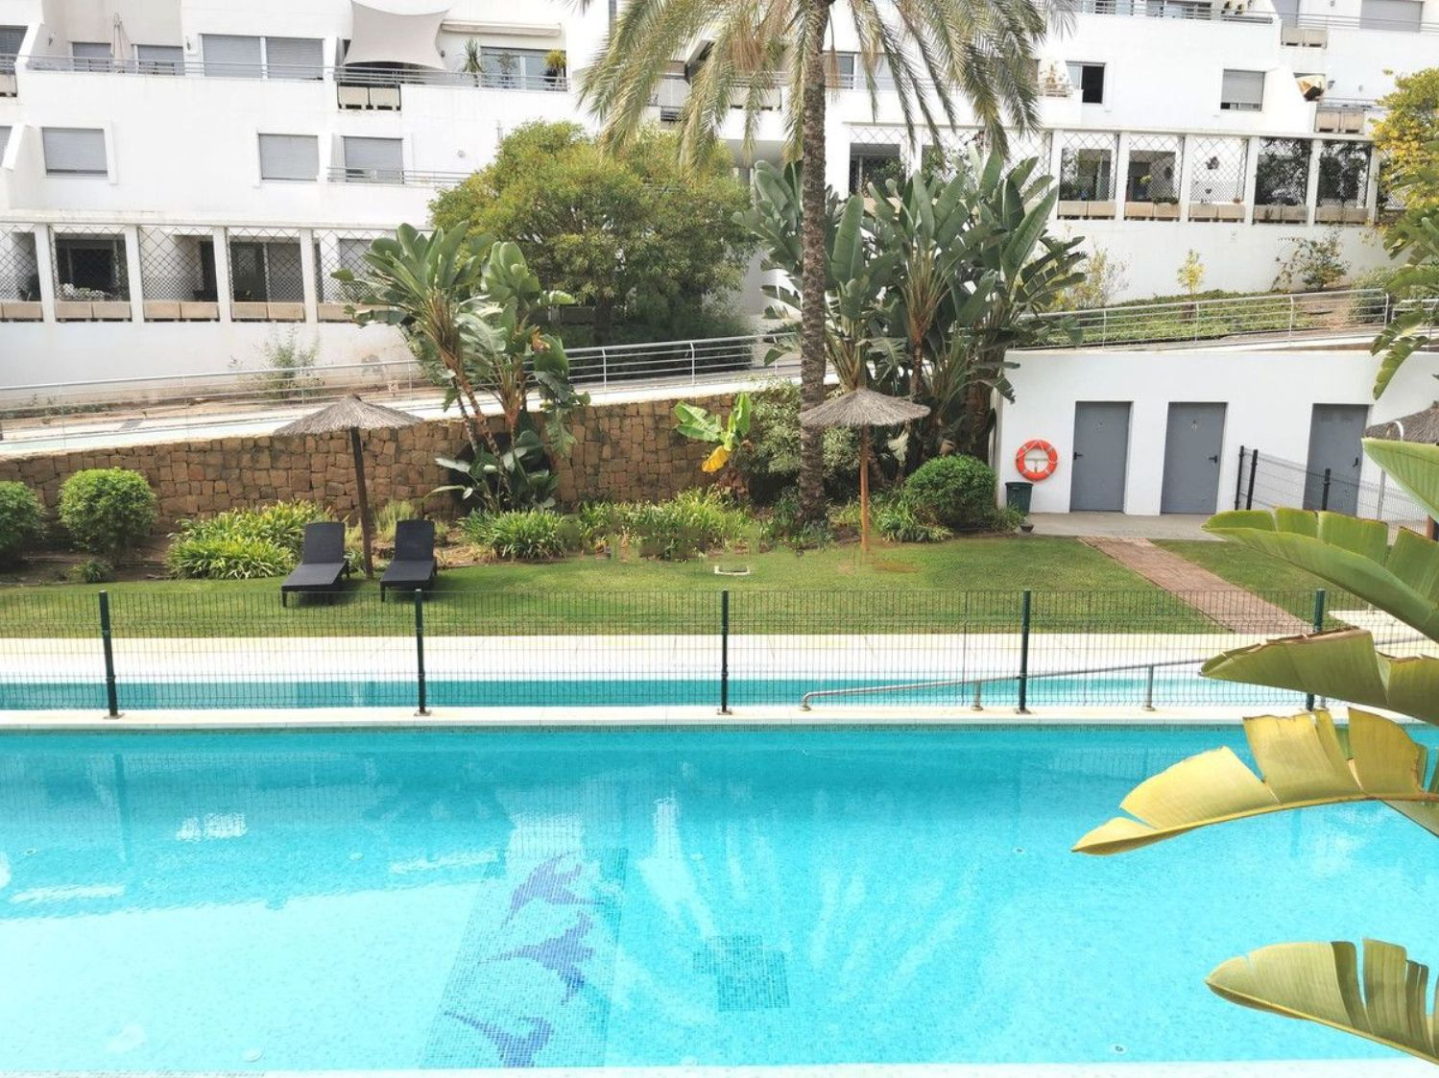
- Pool: Yes
- Garden: No
The location
The price
The following graph shows the average price per m2 trend in hte past 5 years in the neighbourhood versus the property’s current price. This information is useful to understand how market prices are trending in the region and if the property is well priced.
Investment thesis
Prices per night and occupancy
Estimate of the potential short term and vacation rental demand for this property. The graph shows the estimated charged rates per night and average occupancy rates in a calendar year taking into account local seasonality.
Revenue seasonality
Gross revenue estimate if this property is rented during a full calendar year, taking into account the preducted prices per night and occupancy rates.
Investment summary
Estimated core initial investment items, revenue and costs of operating the short term rental property. This is an initial estimate that needs to be reviewed once the property is visited.
Investment scenarios
Like in every investment, there are uncertainties and risks associated with buying a property that could impact the financial outcome of the investment. Here are 3 scenarios:
- Downside: short term rental demand is lower than observed in the past years, impacting prices per night and occupancy rates. Some costs end up being higher than expected
- Base: prices per night and occupancy rates meet the average comparable properties in the area.
- Upside: the property performs better than average or the demand grows beyond average demand in the past years.
€169.000
-
Net rental yield Estimated annual rental return, calculated as: (Estimated annual income - operating expenses) / (Purchase price + renovation) 5,6%
-
Annual net income Rental revenue net of all operating expenses (Property management, cleaning, communal fees, utilities,...). It does not include mortgage payments or income taxes. €10.155
-
Price / m2 discount Estimated discount per m2 of this property compared to other similar properties within 300m -42%
-
Transaction costs Transaction costs (Notary, agency fees and registry), taxes (ITP) and property renovation €34.655